Daily Total Generation by Generation Source (MWh)
This dataset reports the daily electricity generation mix in the United States by energy source, including natural gas, coal, nuclear, wind, solar, hydroelectric, battery storage, and other sources. Generation values are aggregated at the national level and presented by calendar day, providing near–real-time visibility into how total electricity production is distributed across fuel types. All values are expressed in megawatt-hours (MWh) and represent total daily net generation by source.
Last updated: December 1, 2025
How to Read This Chart
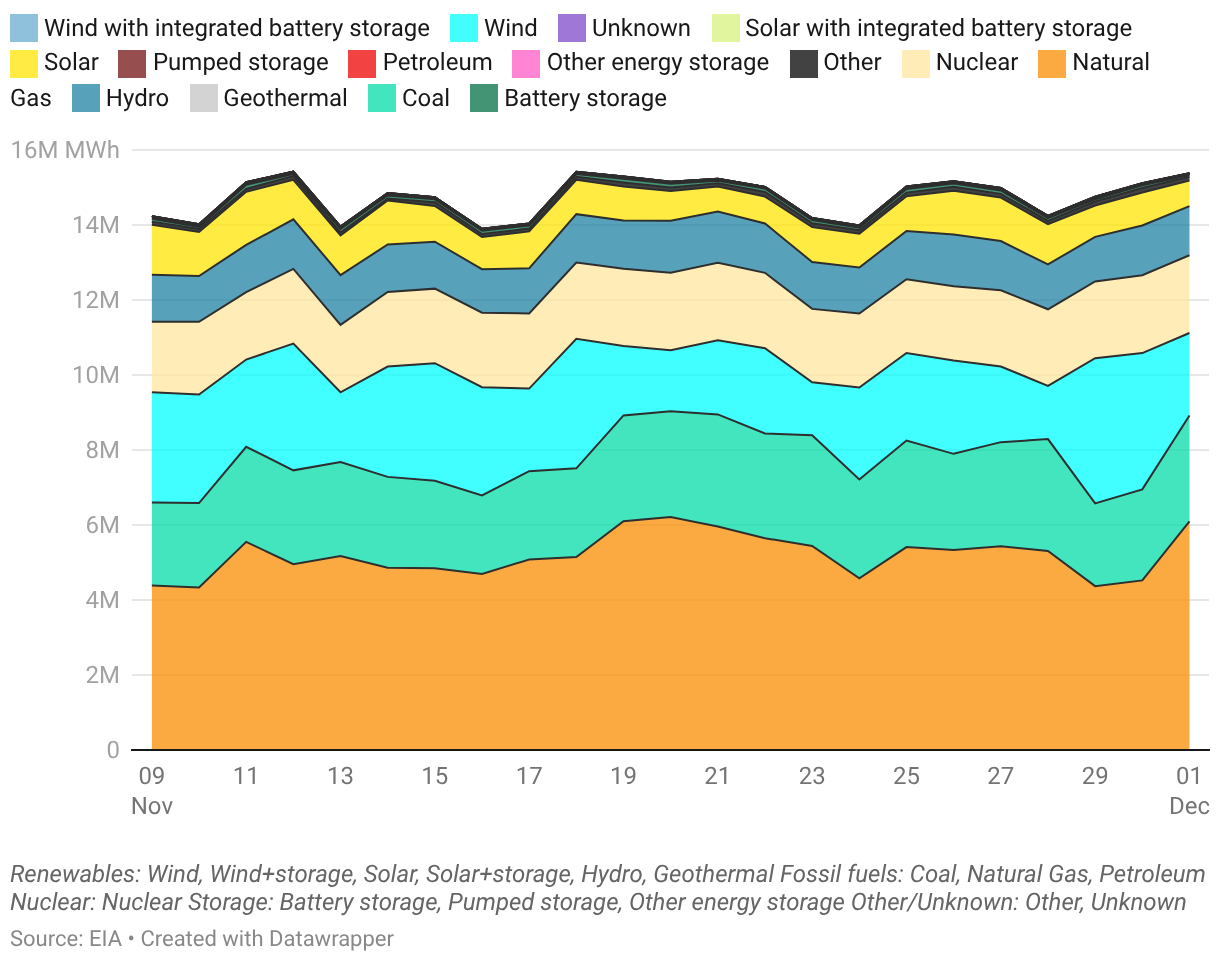
This stacked area chart shows daily total electricity generation in the United States by individual generation source, measured in megawatt-hours (MWh). Each colored band represents a specific source, including natural gas, coal, nuclear, wind, solar, hydroelectric, geothermal, petroleum, and multiple energy-storage–related categories such as battery storage, pumped storage, and storage integrated with wind or solar. The horizontal axis shows individual calendar days, while the vertical axis shows total electricity generated each day. The thickness of each band indicates how much electricity each source contributed on a given day, and the total height of the stack represents overall daily U.S. electricity generation. Variations from day to day reflect changes in demand, weather conditions, and resource availability.
Why This Matters
Breaking generation out by individual source provides detailed insight into how different fuels and technologies contribute to electricity supply on a day-to-day basis. The chart highlights the dominant role of natural gas in meeting daily demand, the consistent contribution from nuclear, and the variable output of wind, solar, and hydro, alongside the growing operational presence of energy storage. This level of detail is critical for understanding grid operations, fuel dependence, and renewable integration challenges. For system operators, policymakers, and researchers, daily source-level generation data supports analysis of reliability, flexibility needs, and how emerging technologies like battery storage are being used to balance variability across the power system.
Key Insights
The following highlights are derived directly from the most recent available data in this dataset using standardized calculations. Metrics reflect the daily distribution of U.S. electricity generation across all reported sources and are computed from the underlying time series. Unless otherwise noted, comparisons are based on the most recent complete reporting day and the prior day. These highlights provide a concise snapshot of the current U.S. generation mix.
Total U.S. electricity generation on December 1, 2025: approximately 15.4 million MWh, an increase of 1.7% day-over-day compared with November 30, 2025.
Generation mix on December 1, 2025: Natural gas accounted for 39.7% of total generation, followed by Coal (18.4%), Wind (14.3%), Nuclear (13.5%), and Hydro (8.5%).
Largest day-over-day change: Natural gas generation increased by approximately 1.6 million MWh, representing the largest absolute change among all reported sources.
Definitions
| Term | Description |
|---|---|
| Electricity generation mix | The distribution of total electricity generation across different energy sources on a given day. |
| Energy source | The primary fuel or technology used to generate electricity, such as natural gas, coal, nuclear, wind, solar, hydroelectric, or battery storage. |
| Megawatt-hour (MWh) | A unit of energy equal to one megawatt of power sustained for one hour. |