Monthly PUCT Informal Disconnection Complaints (2024 - Oct 2025)
This dataset reports monthly informal electricity disconnection complaints in Texas, capturing the number of shutoff-related complaints filed during each reporting period. Complaint counts are aggregated at the statewide level and presented by calendar month from 2024 onward, providing a time series view of how disconnection-related issues change over time. All values represent counts of complaints recorded during the month.
Last updated: October 2025
How to Read This Chart
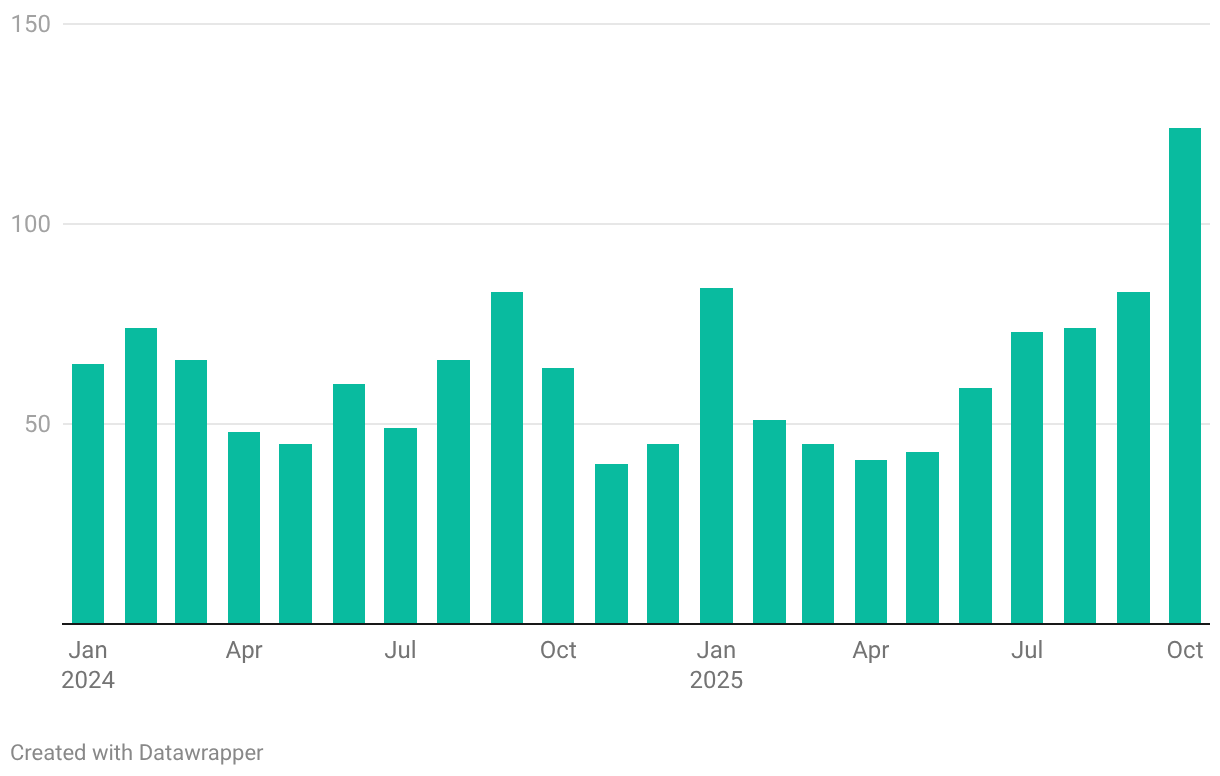
This bar chart shows the monthly number of informal disconnection-related complaints filed with the Public Utility Commission of Texas (PUCT). Each bar represents a single month, and the height of the bar indicates the total number of complaints recorded during that month. The horizontal axis shows the calendar month and year, while the vertical axis shows the complaint count. Comparing bars across months highlights changes in complaint volume over time.
Why This Matters
Monthly disconnection complaint trends provide insight into short-term consumer stress and affordability challenges in the Texas retail electricity market. Increases in complaints may coincide with higher bills, seasonal demand spikes, extreme weather, or economic pressures that make it harder for customers to keep accounts current. Tracking these trends helps regulators and policymakers monitor consumer protection risks in near real time and assess whether additional outreach, protections, or policy responses may be needed. For researchers and advocates, this data offers a timely signal of how market and household conditions are affecting customers’ ability to maintain electric service.
Key Insights
The following highlights are derived directly from the most recent available data in this dataset using standardized calculations. Metrics reflect aggregate informal disconnection complaints in Texas and are computed from the underlying monthly time series. Unless otherwise noted, comparisons are based on the most recent complete reporting month and the prior month. These highlights provide a concise snapshot of recent disconnection complaint activity.
Total informal disconnection complaints in October 2025: 124 complaints, the highest monthly count in the dataset.
Month-over-month change: Complaint counts increased by 49.4% compared with September 2025.
3-month average complaints: approximately 93.7 complaints, based on August through October 2025.
Definitions
| Term | Description |
|---|---|
| Informal disconnection complaints | Customer complaints submitted to the Public Utility Commission of Texas related to electricity service disconnections that do not proceed through a formal adjudication process. |
| Disconnection complaint count | The total number of informal disconnection complaints recorded during a reporting month. |
| Month-over-month change | The percentage difference in complaint counts between consecutive reporting months. |