Monthly US Residential & Commercial Natural Gas Consumption (mmcf)
This dataset reports monthly U.S. natural gas consumption by customer sector, including residential and commercial customers. Consumption values are aggregated at the national level and presented by calendar month from August 2024 onward, providing a time series view of short-term demand patterns. All values are expressed in million cubic feet (MMcf) and represent total natural gas consumed by each sector during the reporting month.
Last updated: August 2025
How to Read This Chart
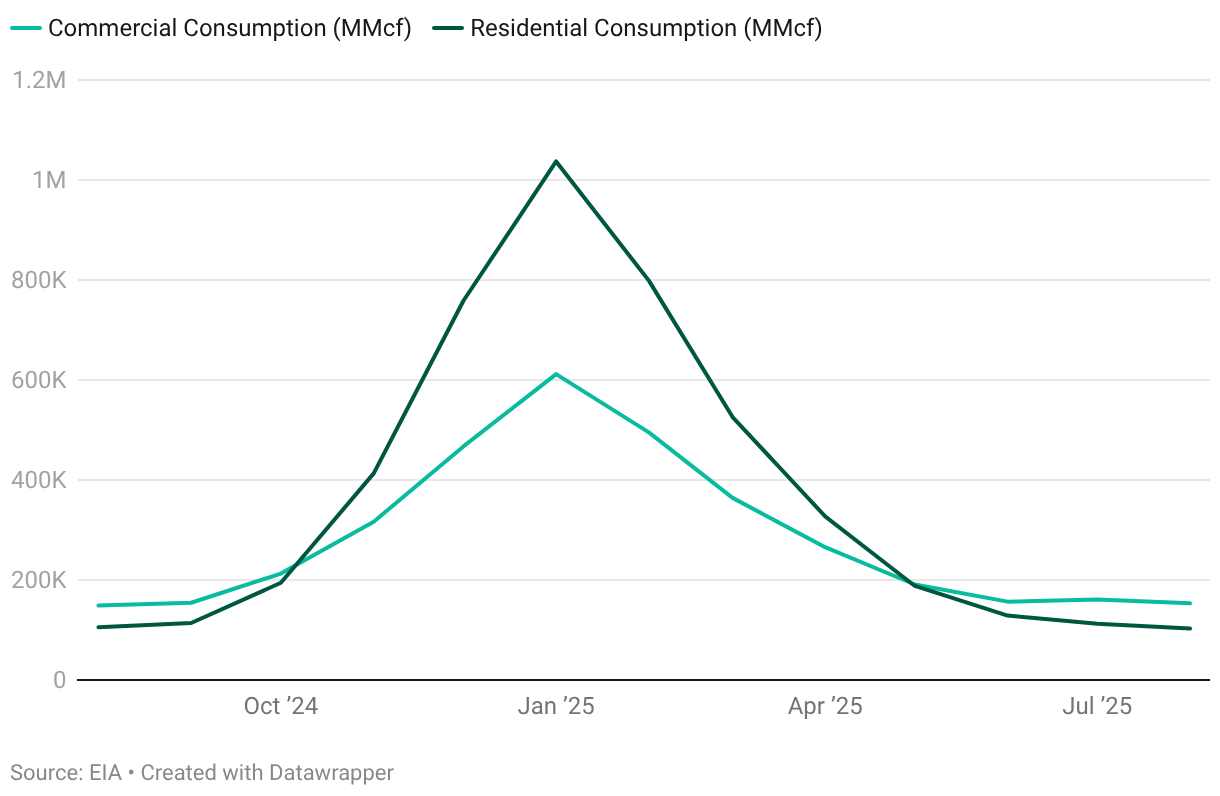
This line chart shows monthly natural gas consumption in the United States for the Residential and Commercial sectors, measured in million cubic feet (MMcf). Each line represents one sector, allowing comparison of how gas use changes month to month across customer types. The horizontal axis shows the reporting month, while the vertical axis shows total natural gas consumption. Peaks indicate periods of higher usage, while declines reflect lower demand.
Why This Matters
Residential and commercial natural gas consumption is highly seasonal, driven primarily by space-heating demand during colder months. The sharp winter peak and summer trough visible in the chart highlight how weather conditions strongly influence gas demand. Understanding these seasonal patterns is critical for supply planning, storage management, and price stability. For utilities, policymakers, and market participants, this data helps anticipate peak demand periods, manage infrastructure capacity, and ensure reliable service during extreme weather. For consumers and researchers, it provides insight into how natural gas use responds to seasonal and climatic factors.
Key Insights
The following highlights are derived directly from the most recent available data in this dataset using standardized calculations. Metrics reflect aggregate U.S. natural gas consumption across residential and commercial customers and are computed from the underlying monthly time series. Unless otherwise noted, comparisons are based on the most recent complete reporting month and the prior month. These highlights provide a concise snapshot of current consumption levels.
Total U.S. residential and commercial natural gas consumption in August 2025: approximately 256,215 MMcf.
Month-over-month change: Total consumption declined by 6.4% compared with July 2025.
Sector shares in August 2025: Commercial customers accounted for 59.8% of total consumption, while Residential customers accounted for 40.2%.
Definitions
| Term | Description |
|---|---|
| Natural gas consumption | The volume of natural gas delivered to and consumed by end-use customers during a reporting period. |
| Residential customers | Households using natural gas primarily for space heating, water heating, cooking, and other domestic uses. |
| Commercial customers | Businesses and institutions using natural gas for heating, operations, and on-site energy needs. |