Retail Electric Provider PUCT Informal Complaints by Complaint Category (2024 - Oct 2025)
This dataset reports informal complaint counts by category for Texas retail electricity providers, detailing the types of issues most frequently reported by customers. Complaint values are aggregated by complaint category and represent the total number of informal complaints filed during the reporting period. All values are expressed as counts of complaints, with category-level shares provided as percentages of total complaints.
Last updated: October 2025
How to Read This Chart
This table shows informal complaints filed with the Public Utility Commission of Texas (PUCT) against retail electricity providers, grouped by complaint category. Each row lists a complaint type along with the total number of complaints and the share of all complaints, expressed as a percentage. The “Share of Complaints” column indicates how much each category contributes to the overall complaint volume, allowing users to quickly see which issues are most common.
Why This Matters
Breaking complaints down by category highlights the most frequent sources of consumer dissatisfaction in the retail electricity market. Billing issues account for nearly half of all informal complaints, followed by provision and discontinuance of service, suggesting that pricing clarity, service delivery, and account management are the primary drivers of consumer concerns. Understanding the distribution of complaint types helps regulators, policymakers, and market participants prioritize oversight, enforcement, and consumer education efforts. For consumers and researchers, this data provides transparency into where problems most often arise and complements refund and complaint trend data by showing the underlying composition of reported issues.
Key Insights
The following highlights are derived directly from the most recent available data in this dataset using standardized calculations. Metrics reflect aggregate complaint volumes across all reported categories and are computed from the underlying data. Unless otherwise noted, figures refer to totals within the available reporting period. These highlights provide a concise snapshot of the most common complaint types.
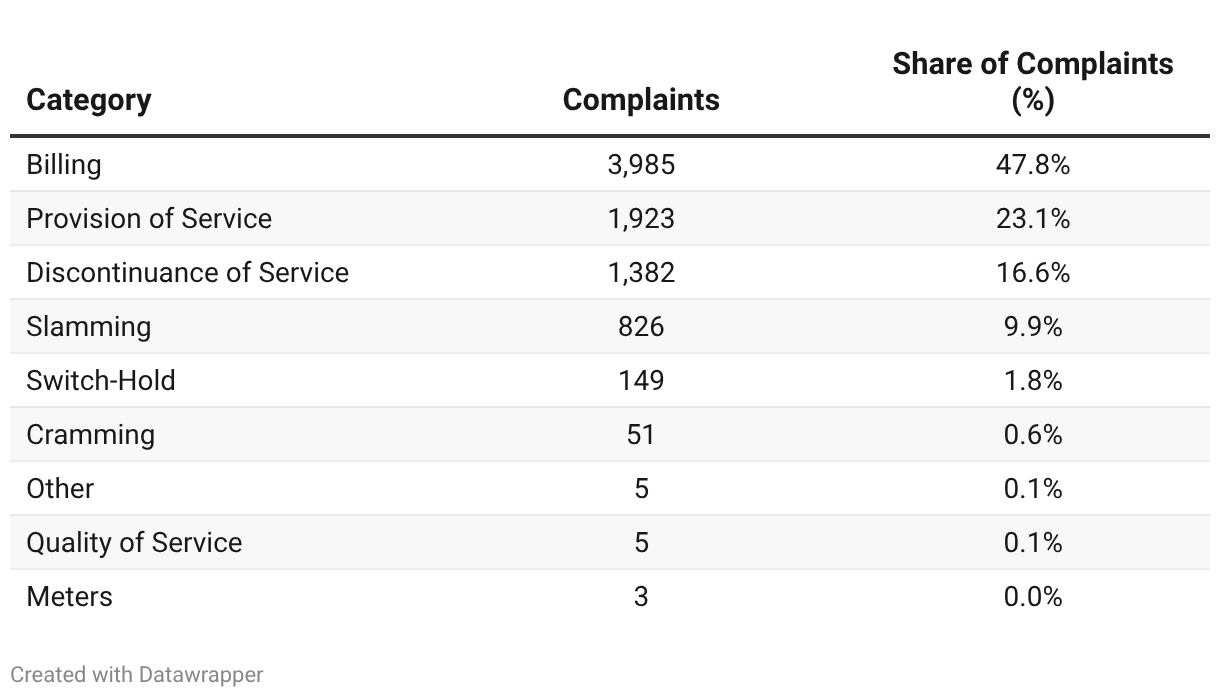
Total informal complaints reported: 8,335 complaints across all categories.
Most common complaint category: Billing-related issues accounted for 3,985 complaints, representing 47.8% of all complaints.
Next most frequent categories: Provision of Service (1,923 complaints; 23.1%) and Discontinuance of Service (1,382 complaints; 16.6%).
Definitions
| Term | Description |
|---|---|
| Informal complaints | Customer complaints submitted to regulators or oversight bodies that do not proceed through a formal adjudication process. |
| Complaint category | Classification describing the nature of the customer issue, such as billing, service provision, discontinuance of service, slamming, or enrollment-related issues. |
| Complaint count | The total number of informal complaints recorded for a given category. |