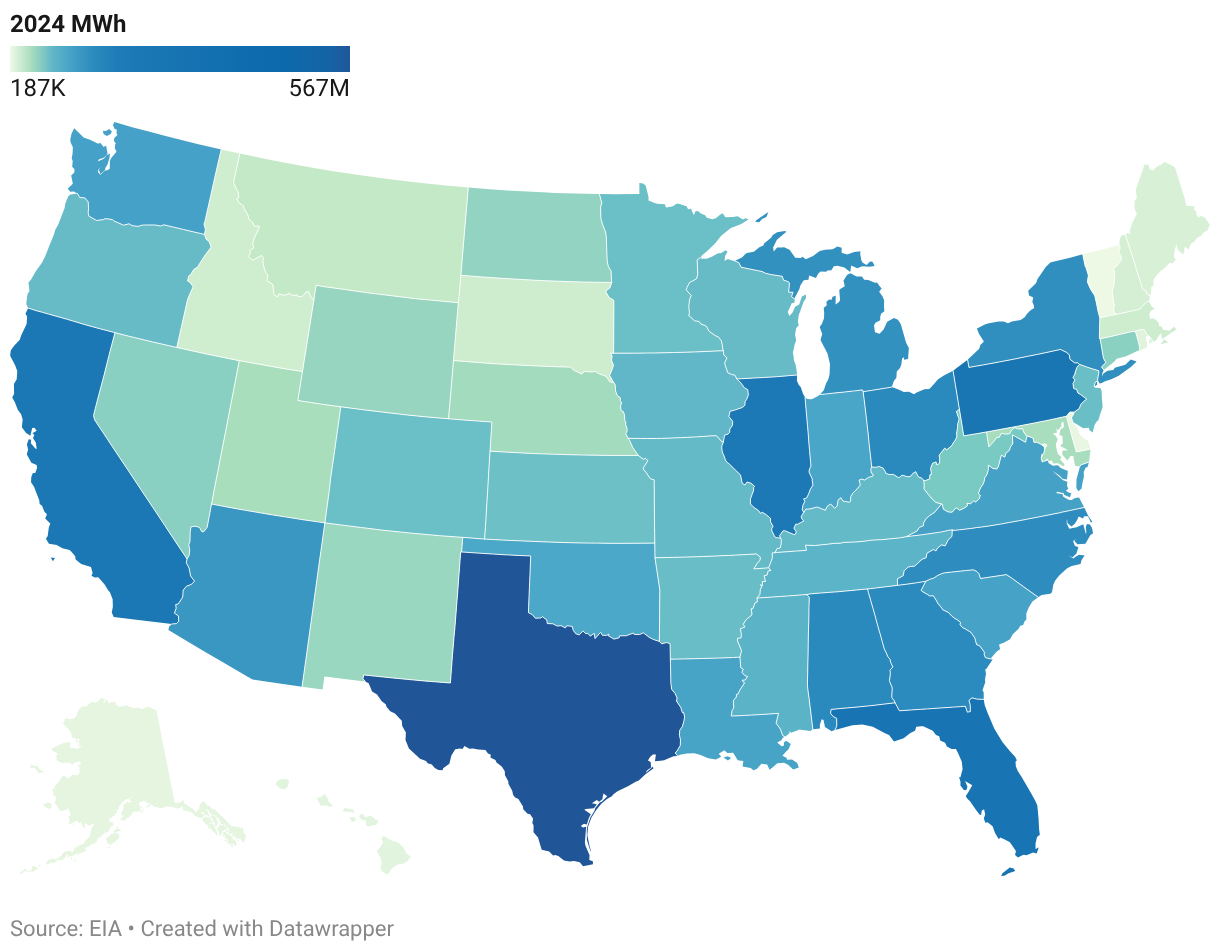
2024 Total Net Electricity Generation (MWh) by State
This dataset reports net electricity generation by U.S. state for calendar year 2024, identifying where electricity production was highest and how generation is distributed geographically across the country. Generation values are reported at the state level and represent total net electricity produced by in-state generating facilities during the year. All values are expressed in megawatt-hours (MWh).
Last updated: 2024
How to Read This Chart
This map shows total net electricity generation by U.S. state in 2024, measured in megawatt-hours (MWh). Each state is shaded according to the amount of electricity generated within its borders during the year, with darker colors indicating higher generation levels. The color scale reflects the full range of state-level generation values, allowing quick visual comparison across regions. Users can hover or interact with individual states to see exact generation totals.
Why This Matters
A geographic view of electricity generation highlights where power is produced across the U.S., revealing regional patterns driven by population, resource availability, and energy infrastructure. States with darker shading typically combine large demand centers with extensive generation capacity, while lighter-shaded states may rely more on imported electricity. This perspective is essential for understanding regional supply concentration, transmission dependencies, and grid resilience. For policymakers, utilities, and researchers, mapping generation data helps identify infrastructure investment needs, regional imbalances, and how electricity production is distributed nationwide.
Key Insights
The following highlights are derived directly from the most recent available data in this dataset using standardized calculations. Metrics reflect aggregate net electricity generation across U.S. states and are computed from the underlying annual data. Unless otherwise noted, comparisons refer to totals within the 2024 reporting year. These highlights provide a concise snapshot of state-level electricity production.
Total U.S. net electricity generation in 2024: approximately 4.31 billion MWh across all states.
Top electricity-producing state in 2024: Texas generated approximately 566.5 million MWh, the highest among all U.S. states.
Top five producing states in 2024: Texas, Florida (266.1 million MWh), Pennsylvania (241.5 million MWh), California (214.2 million MWh), and Illinois (185.0 million MWh).
Definitions
| Term | Description |
|---|---|
| Net electricity generation | The amount of electricity produced by power plants minus the electricity consumed for plant operations during the reporting year. |
| State-level generation | Electricity generation attributed to power plants located within a specific U.S. state or jurisdiction. |
| Megawatt-hour (MWh) | A unit of energy equal to one megawatt of power sustained for one hour. |