ENERGY, ELECTRICITY, AND NATURAL GAS
U.S. Energy Market Data, Rate Insights, & Grid Conditions
Explore interactive energy, electricity, and natural gas data across all states. Compare average electric and natural gas rates, power generation and capacity, energy efficiency, complaint trends, short-term price outlooks, retail sales, and delivery charges, with deep dives for Texas and other major markets.
U.S. Overall Energy Data
Daily Total Generation by Energy Source (MWh)
This dataset reports daily total electricity generation in the United States by energy source, including fossil fuels, nuclear, renewables, storage, and other sources. Generation values are aggregated at the national level and presented by calendar day, providing near–real-time visibility into how much electricity is produced by each fuel type. All values are expressed in megawatt-hours (MWh) and represent total daily net generation for each source.

Total US Generation Capacity (MWh) by Generation Source
This dataset reports total U.S. electricity generation capacity by energy source, including natural gas, coal, nuclear, wind, solar, hydroelectric, battery storage, and other sources. Capacity values are aggregated at the national level and presented by calendar year from 2019 through 2024, representing the maximum installed nameplate capacity available to generate electricity in each year. All values are expressed in megawatt-hours (MWh).

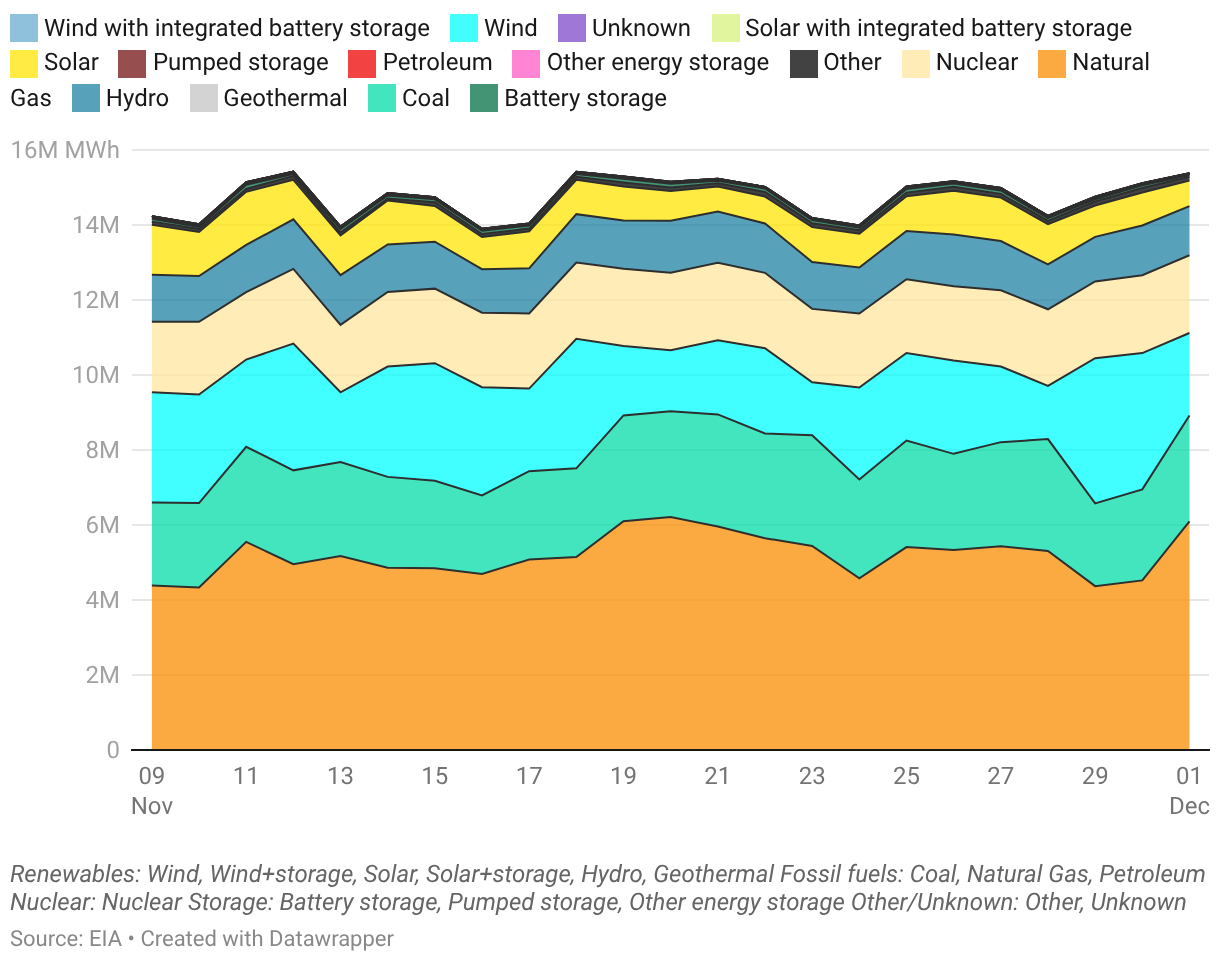
Daily Total Generation by Generation Source (MWh)
This dataset reports the daily electricity generation mix in the United States by energy source, including natural gas, coal, nuclear, wind, solar, hydroelectric, battery storage, and other sources. Generation values are aggregated at the national level and presented by calendar day, providing near–real-time visibility into how total electricity production is distributed across fuel types. All values are expressed in megawatt-hours (MWh) and represent total daily net generation by source.
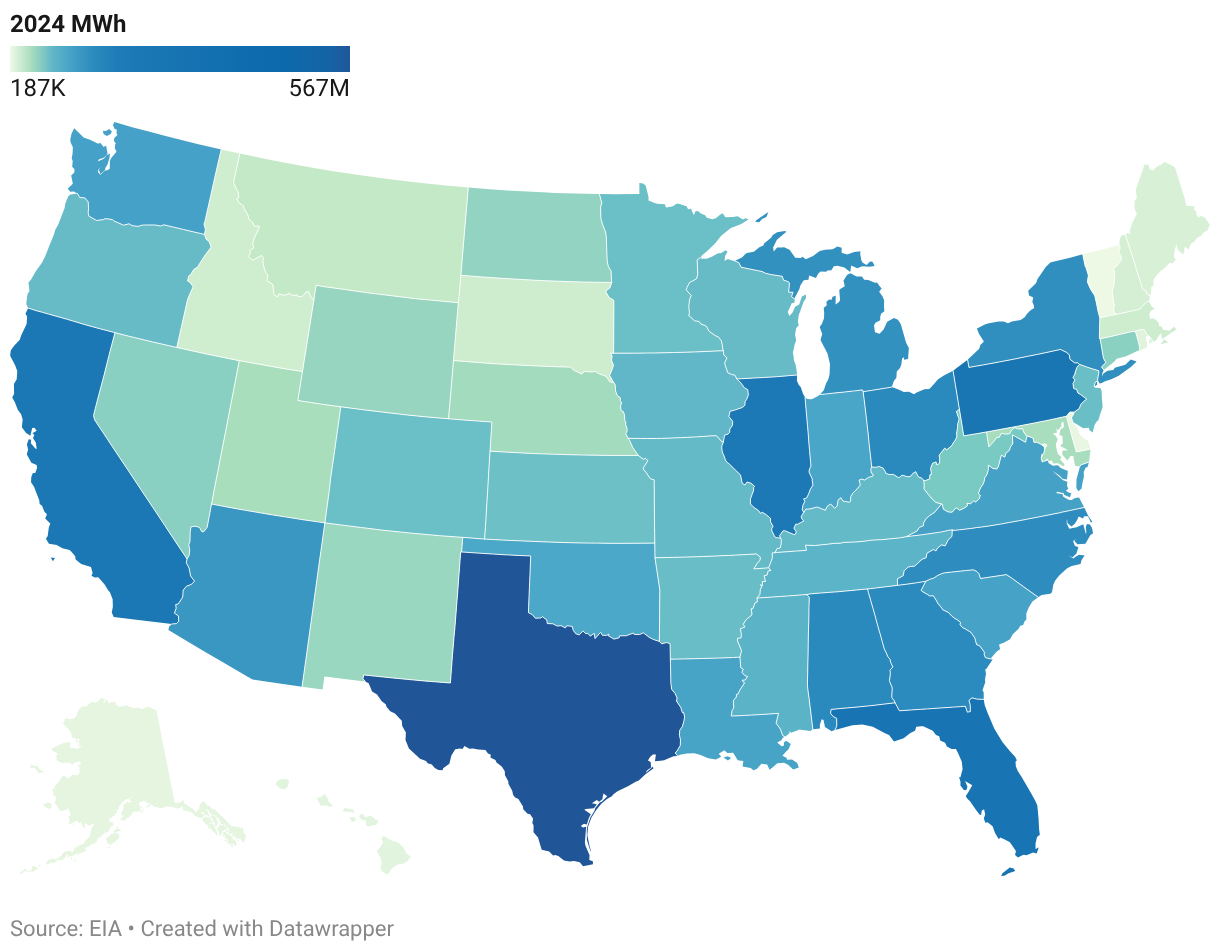
2024 Total Net Electricity Generation (MWh) by State
This dataset reports net electricity generation by U.S. state for calendar year 2024, identifying where electricity production was highest and how generation is distributed geographically across the country. Generation values are reported at the state level and represent total net electricity produced by in-state generating facilities during the year. All values are expressed in megawatt-hours (MWh).
Daily Renewables Share of Total Generation (MWh)
This dataset reports the daily share of total U.S. electricity generation attributable to renewable energy sources, including wind, solar, hydroelectric, geothermal, and renewables paired with energy storage. Values are aggregated at the national level and presented by calendar day, reflecting the proportion of total electricity generation supplied by renewable sources. All values are expressed as a percentage of total daily generation.

Explicit State Information
TX Electricity Consumed by Sector (MWh)
This dataset reports annual electricity consumption in Texas by end-use sector, including residential, commercial, industrial, and transportation consumption. Data are aggregated at the statewide level and presented by calendar year from 2015 through 2023, allowing for longitudinal analysis of sector-level demand patterns. All values are expressed in megawatt-hours (MWh) and represent total electricity consumed within each sector during the reporting year.

Total Annual Net Electricity Generation (MWh) by State
This dataset reports annual net electricity generation by U.S. state from 1990 through 2024, capturing long-term changes in power production across the country. Generation values are reported at the state level and represent total net electricity produced by in-state generating facilities during each calendar year. All values are expressed in megawatt-hours (MWh). The dataset is structured as a longitudinal time series to support analysis of historical growth, decline, and geographic shifts in electricity generation.

Top 10 States Total Net Electricity Generation (MWh)
This dataset ranks the top U.S. states by annual net electricity generation from 1990 through 2024, highlighting where the largest shares of domestic electricity production are concentrated. Generation values are reported at the state level and represent total net electricity produced by in-state generating facilities during each calendar year. All values are expressed in megawatt-hours (MWh).

Texas & Northeast States Annual Generation Capacity (MWh)
This dataset reports annual electricity generation capacity in Texas and selected Northeast states, enabling comparison of how installed capacity has changed across regions over time. Capacity values are aggregated at the state level and presented by calendar year from 2019 through 2024, reflecting the total installed generation capacity available in each region during each reporting year. All values are expressed in megawatt-hours (MWh).

U.S. Overall Energy Data
US Total Annual Energy Efficiency Realized Savings (MWh) by Sector
This dataset reports annual first-year electricity savings from U.S. energy efficiency programs by customer sector, including residential, commercial, and industrial programs. Savings values are aggregated at the national level and presented by calendar year from 2013 through 2019, representing the estimated reduction in electricity consumption attributable to efficiency measures implemented during each reporting year. All values are expressed in megawatt-hours (MWh).

US Program Realized Costs (thousands of $) by Sector
This dataset reports annual energy efficiency program costs by customer sector, including residential, commercial, and industrial programs. Cost values are aggregated at the program level and presented by calendar year from 2013 through 2019, reflecting total expenditures incurred to deliver energy efficiency initiatives within each sector. All values are expressed in nominal U.S. dollars and represent realized program costs for the reporting year.

Total Annual Program Lifecycle Costs (Thousands of $)
This dataset reports annual lifecycle costs of U.S. energy efficiency programs, representing the total committed spending associated with efficiency measures initiated in each reporting year. Cost values are aggregated at the national level and presented by calendar year from 2013 through 2024, capturing long-term investment commitments across residential, commercial, and industrial efficiency programs. All values are expressed in nominal U.S. dollars, reported in thousands of dollars.

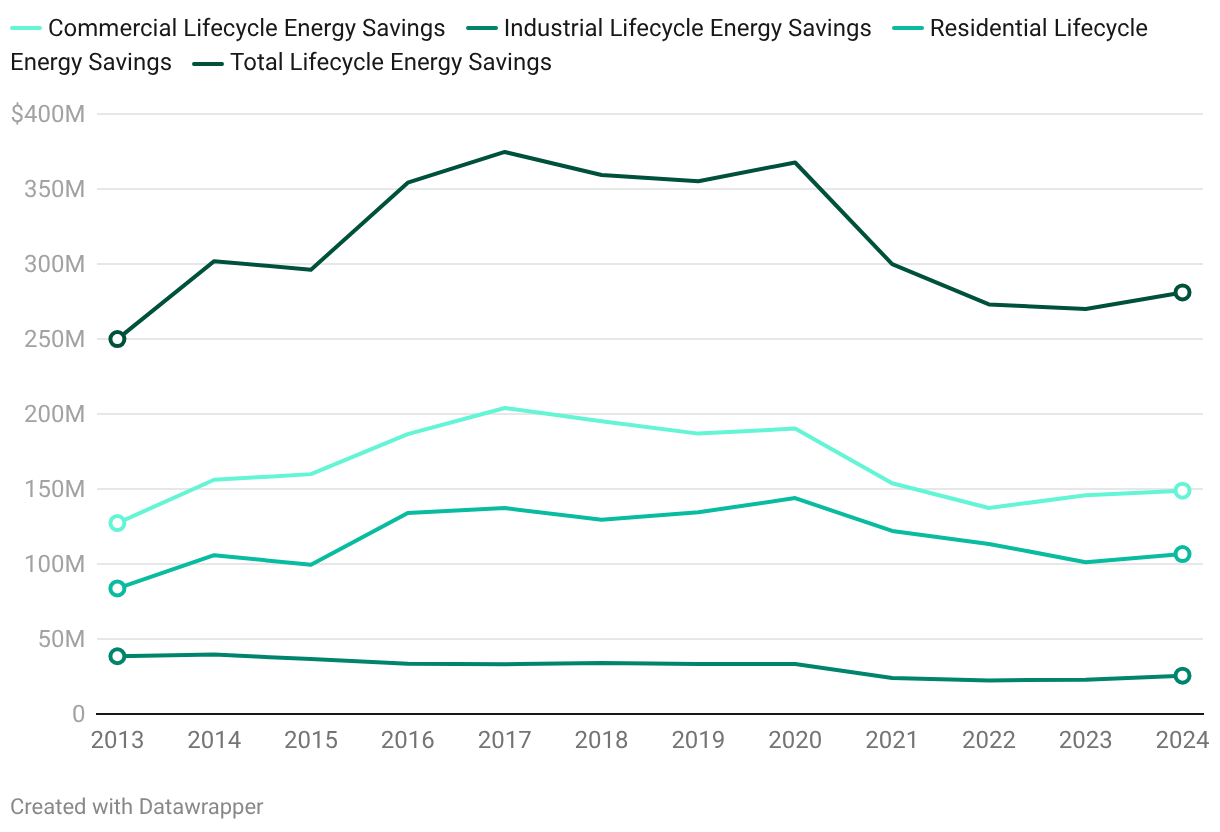
Total Annual Lifecycle Energy Savings by Sector (MWh)
This dataset reports annual lifecycle electricity savings from U.S. energy efficiency programs by customer sector, measuring the total lifetime electricity savings attributable to programs installed in each reporting year. Savings values are aggregated at the national level and presented by calendar year from 2013 through 2024, reflecting estimated long-term reductions in electricity consumption across residential, commercial, and industrial programs. All values are expressed in megawatt-hours (MWh).
Explicit State Information
Top 10 Annual State Energy Realized Savings (MWh) from Energy Efficiency Programs
This dataset ranks the top U.S. states by annual realized electricity savings from energy efficiency programs, highlighting where the largest reductions in electricity consumption were achieved in each reporting year. Savings values are reported at the state level and represent first-year electricity savings attributable to efficiency programs implemented during the calendar year. All values are expressed in megawatt-hours (MWh).

2019 Total Realized Incentives Paid to Customers
This dataset reports customer incentives paid for energy efficiency programs by U.S. state, capturing rebates, bill credits, and other direct incentives provided to households and businesses. Incentive values are reported at the state level and presented by calendar year, with this dataset focusing on 2019 as the most recent reporting year. All values are expressed in nominal U.S. dollars and represent realized incentive payments made during the year.

Explicit State Information
Top 10 PUCT Informal Disconnect Complaints by City (2024 - Oct 2025)
This dataset reports informal electricity disconnection complaints filed with the Public Utility Commission of Texas (PUCT) by city, highlighting where shutoff-related issues are most frequently reported. Complaint counts are aggregated at the city level and reflect informal complaints submitted since 2024, capturing geographic patterns in reported service disconnections across Texas. All values represent counts of complaints recorded during the reporting period.

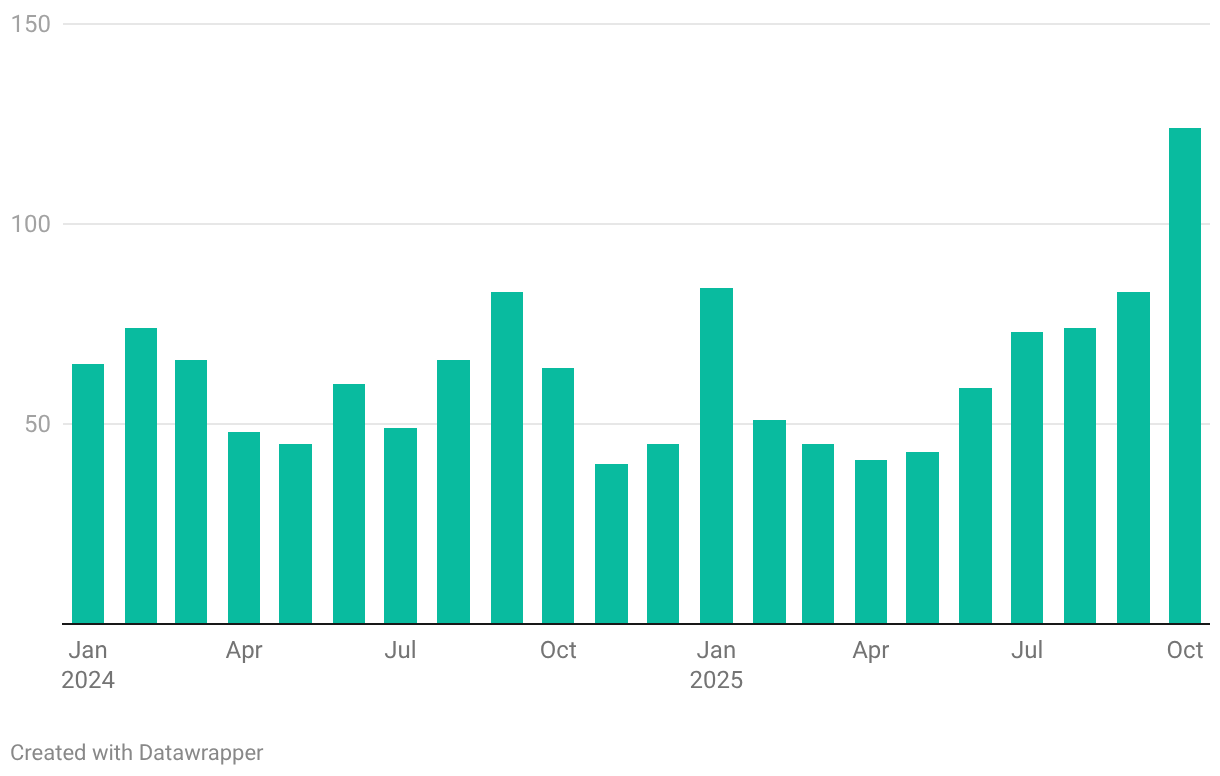
Monthly PUCT Informal Disconnection Complaints (2024 - Oct 2025)
This dataset reports monthly informal electricity disconnection complaints in Texas, capturing the number of shutoff-related complaints filed during each reporting period. Complaint counts are aggregated at the statewide level and presented by calendar month from 2024 onward, providing a time series view of how disconnection-related issues change over time. All values represent counts of complaints recorded during the month.
Retail Electricity Provider Informal PUCT Complaint Counts (2024 - Oct 2025)
This dataset reports monthly informal complaint counts for Texas retail electricity providers, capturing the volume of customer complaints filed during each reporting period. Complaint counts are aggregated at the provider level and presented by calendar month, providing a time series view of customer service and billing-related issues in the Texas retail electricity market. All values represent counts of complaints submitted during the month.

Refund Dollars by Informal PUCT Complaint Category (2024 - Oct 2025)
This dataset reports refund dollars issued to Texas electricity customers by complaint category, detailing monetary refunds associated with billing disputes, service issues, slamming, cramming, and related complaint types. Refund amounts are aggregated by complaint category and represent total dollars returned to customers during the reporting period. All values are expressed in nominal U.S. dollars.

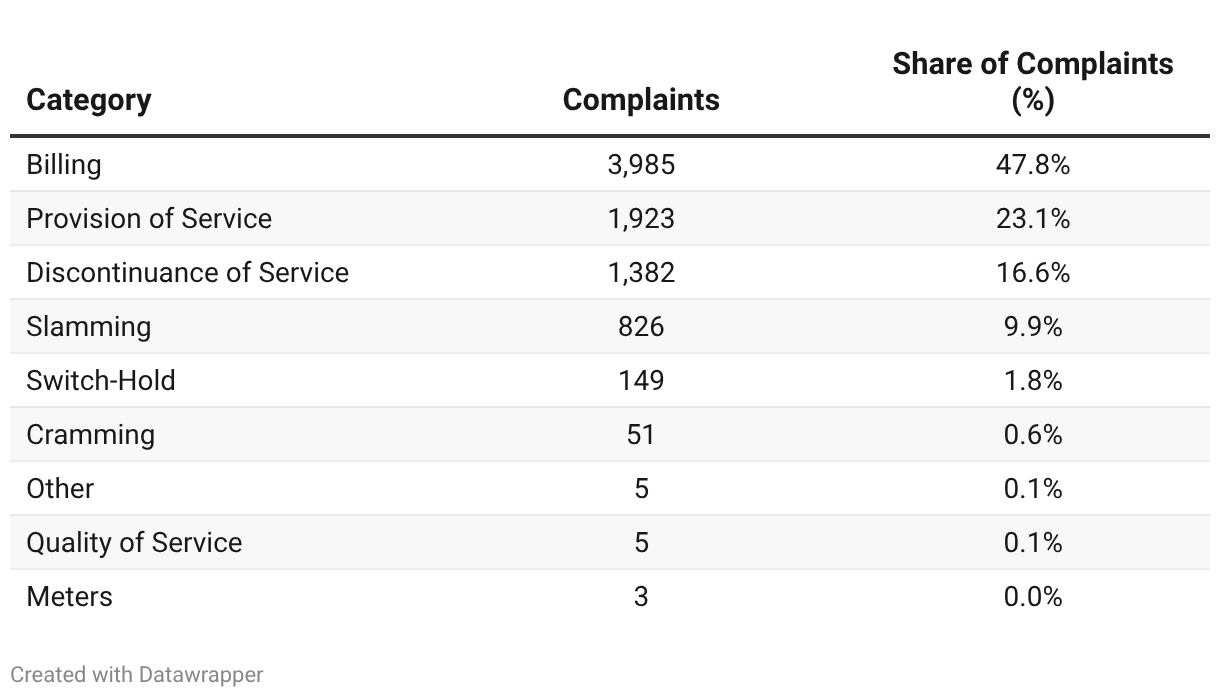
Retail Electric Provider PUCT Informal Complaints by Complaint Category (2024 - Oct 2025)
This dataset reports informal complaint counts by category for Texas retail electricity providers, detailing the types of issues most frequently reported by customers. Complaint values are aggregated by complaint category and represent the total number of informal complaints filed during the reporting period. All values are expressed as counts of complaints, with category-level shares provided as percentages of total complaints.
Refund Rate by Informal Complaint Category (2024 - Oct 2025)
This dataset reports refund rates by complaint category in the Texas retail electricity market, measuring how often customer complaints result in a monetary refund. Refund rates are calculated by category and represent the share of complaints that resulted in refunded dollars for issues such as billing disputes, service provision, discontinuance of service, slamming, and cramming. All values are expressed as percentages.

Explicit State Information
Short Term Residential Electricity Price Outlook (cents per kWh)
This dataset reports annual residential electricity prices in Texas, measured as the average price paid per kilowatt-hour by residential customers. Prices are aggregated at the statewide level and presented by reporting period from 2015 through 2026, providing a long-run view of changes in residential electricity pricing over time. All values are expressed in cents per kilowatt-hour (¢/kWh) and represent average prices paid during each reporting period.

Explicit State Information
TX Residential & Commercial Sales Volumes (MWh)
This dataset reports monthly electricity sales volumes in Texas for residential and commercial customers, measuring the amount of electricity sold to each customer class over time. Sales volumes are aggregated at the statewide level and presented by calendar month from 2015 through August 2025, providing a long-run view of demand patterns in the Texas retail electricity market. All values are expressed in megawatt-hours (MWh) and represent total electricity sales during the reporting month.

TX Average Price (cents per kWh) for Commercial & Residential Customers
This dataset reports the average retail electricity price in Texas for residential and commercial customers, reflecting the all-in price paid per unit of electricity. Prices are aggregated at the statewide level and presented by calendar month from 2015 through August 2025, providing a long-run view of retail electricity pricing trends in the competitive Texas market. All values are expressed in cents per kilowatt-hour (¢/kWh) and represent average prices paid by customers during the reporting month.

TX Residential Customer Counts & Average Price
This dataset reports monthly counts of residential electricity customers in Texas, reflecting the number of households actively served in the competitive retail electricity market. Customer counts are aggregated at the statewide level and presented by calendar month from 2015 through August 2025, providing a time series view of participation trends over time. All values represent counts of active residential customer accounts during the reporting month.

Explicit State Information
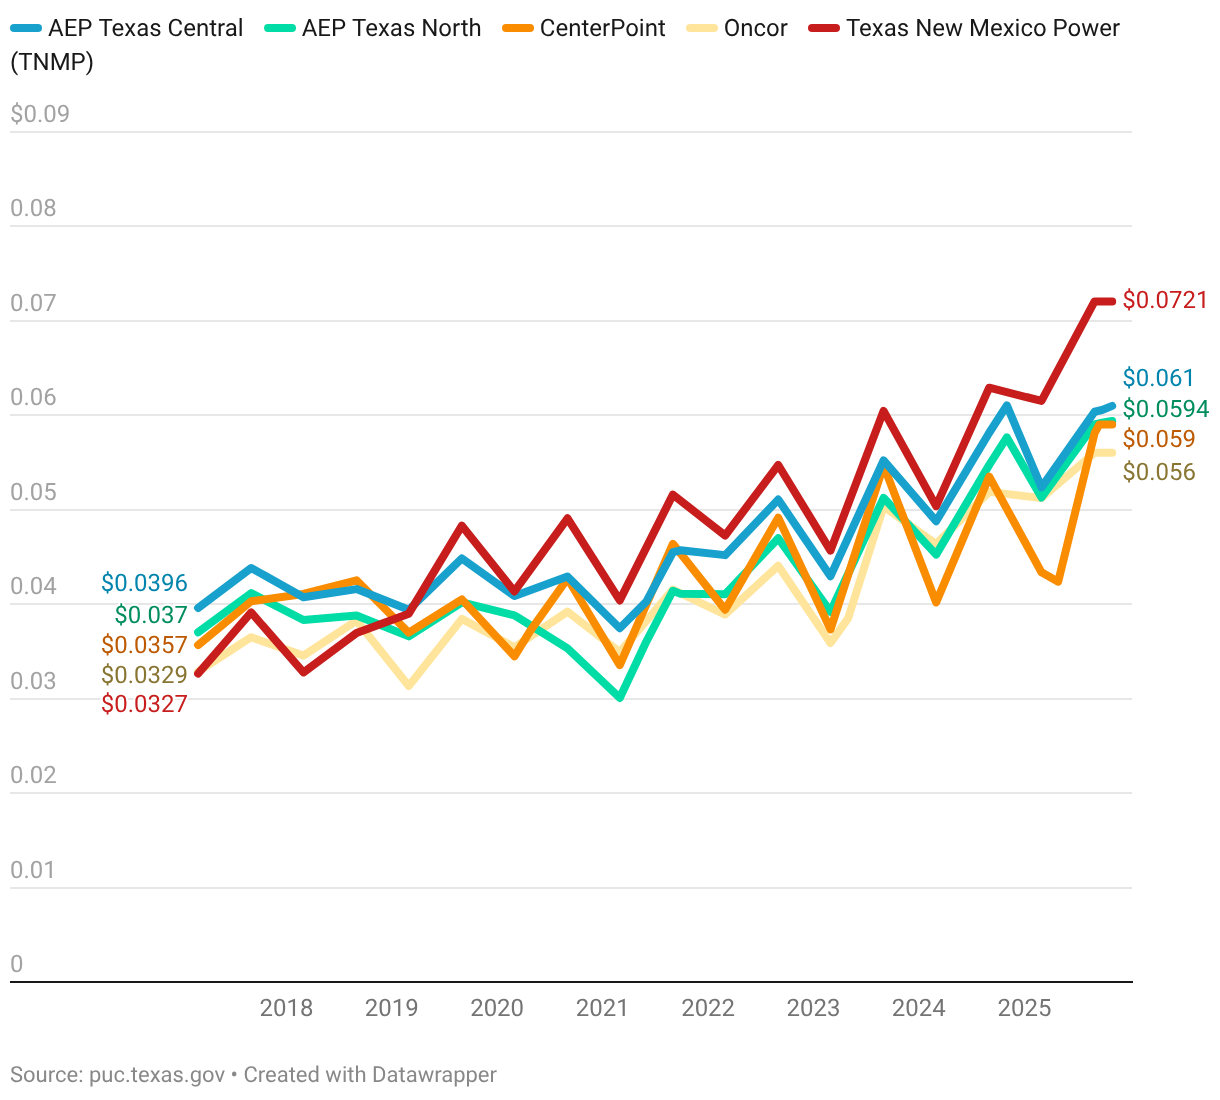
Historic TX TDSP Per kWh Charges by Utility (as of Nov. 1, 2025)
This dataset reports historic Texas transmission and distribution service provider (TDSP) delivery charges, measured as per–kilowatt-hour fees for Oncor, CenterPoint, AEP Texas Central, AEP Texas North, and Texas New Mexico Power (TNMP). Charges are reported at the TDSP level and presented by effective date from 2017 through 2025, providing a historical view of how regulated delivery fees have changed over time. All values are expressed in dollars per kilowatt-hour ($/kWh) and represent distribution charges applied to electricity consumption.
Latest TX Delivery Charges by Utility (as of Nov, 1, 2025)
This dataset reports the latest Texas transmission and distribution service provider (TDSP) delivery charges, listing current utility fees by service area. Charges are reported at the TDSP level and reflect the most recent effective delivery rates applied to electricity consumption regardless of retail electricity provider. The dataset includes both fixed monthly charges and per–kilowatt-hour delivery charges, expressed in U.S. dollars. It provides a point-in-time snapshot of regulated delivery fees across major Texas TDSP territories.

U.S. Overall Energy Data
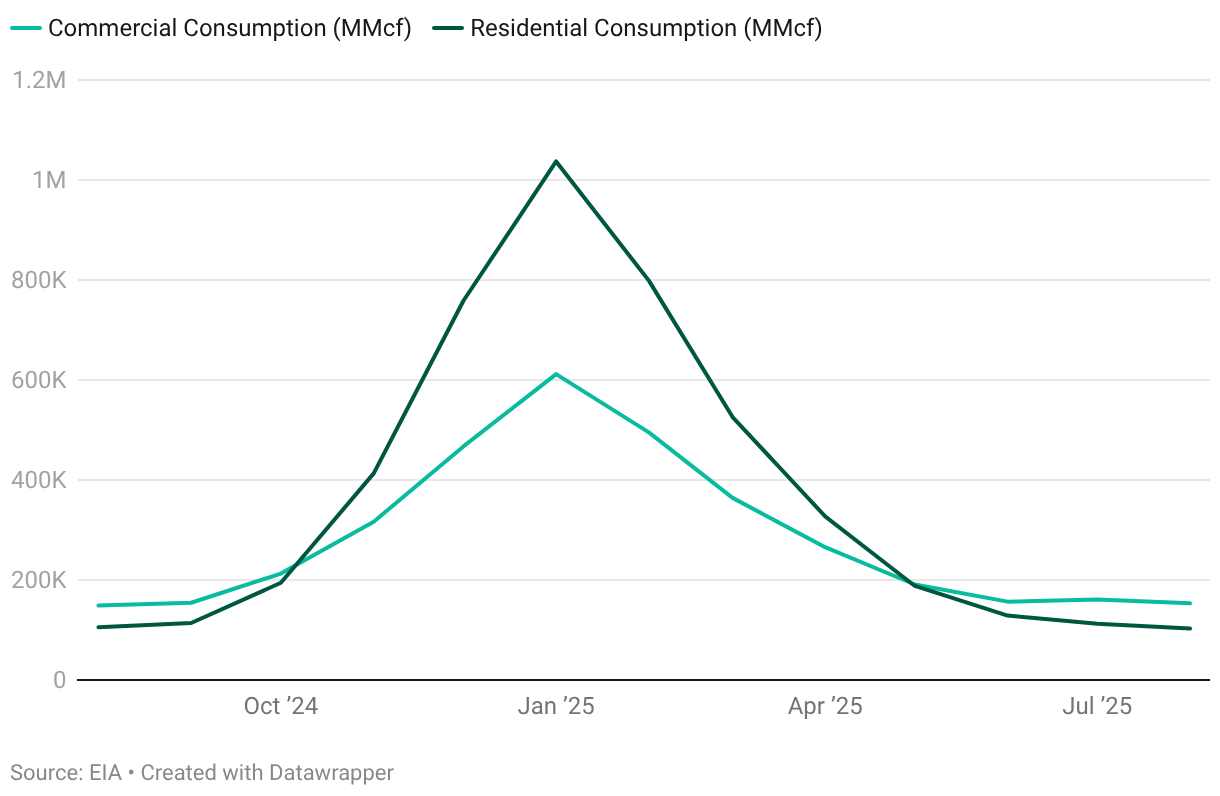
Monthly US Residential & Commercial Natural Gas Consumption (mmcf)
This dataset reports monthly U.S. natural gas consumption by customer sector, including residential and commercial customers. Consumption values are aggregated at the national level and presented by calendar month from August 2024 onward, providing a time series view of short-term demand patterns. All values are expressed in million cubic feet (MMcf) and represent total natural gas consumed by each sector during the reporting month.
U.S. Marketed Natural Gas Production (mmcf)
This dataset reports monthly marketed natural gas production in the United States, measuring the volume of natural gas produced and made available for sale from domestic sources. Production values are aggregated at the national level and presented by calendar month, providing a time series view of U.S. natural gas supply trends. All values are expressed in million cubic feet (MMcf) and represent marketed production, which excludes gas used for repressuring, vented, or flared.
